Mastering Your Leads Conversion Rate: A Practical Marketer's Guide
Unlock growth by mastering your leads conversion rate. This guide covers calculation, benchmarks, and powerful strategies to turn more prospects into customers.
Your lead conversion rate is the percentage of people who see your offer and actually take the next step—like filling out a form or starting a free trial. Think of it as your marketing's batting average.
A high rate tells you that your message is landing perfectly. A low rate? That’s a clear signal that something in your strategy is broken and needs fixing, fast.
Understanding Your Leads Conversion Rate

Imagine your marketing efforts are a giant fishing net. You cast it out into the sea of potential customers, but the real question is, how many fish actually end up in the boat? That simple percentage is your leads conversion rate. It’s the metric that cuts through the noise and shows you how well you’re turning casual interest into actual, tangible leads.
This isn’t just another number to track on a dashboard. It's a direct pulse check on the health of your funnel and the return you’re getting on your marketing spend. A strong rate means your messaging, your offer, and your audience are all in sync. A weak one, however, is a red flag telling you there's a leak somewhere in your funnel that’s costing you money.
Why This Metric Is Crucial for Growth
Keeping a close eye on your leads conversion rate is non-negotiable for a few key reasons. It gives you honest, direct feedback on whether your marketing campaigns, landing pages, and calls-to-action (CTAs) are actually working. Without this number, you’re just guessing what’s effective and what’s burning through your budget.
A deep understanding of this metric is the first step toward reducing customer acquisition costs and accelerating revenue. It transforms marketing from a cost centre into a predictable engine for business growth.
By monitoring this figure, you can stop guessing and start making data-driven decisions to fix your funnel. For example, if a landing page gets tons of traffic but has a dismal conversion rate, you know the problem isn't visibility—it's likely a weak offer or a clunky form. This kind of insight lets you test specific changes that directly impact your bottom line. To really get a handle on this, understanding what is Conversion Rate Optimization and why it's so vital is a must.
Connecting Lead Generation to Business Goals
A healthy leads conversion rate has a ripple effect across the entire business, starting with a more efficient sales pipeline. When marketing consistently delivers a stream of qualified leads, your sales team can stop wasting time prospecting and focus on what they do best: closing deals. This tight alignment between marketing and sales is what separates high-performing companies from the rest.
Ultimately, your conversion rate helps you answer the most important questions about your business:
- Is our marketing resonating? It tells you if your value proposition is clear and convincing enough to make someone act.
- Are we targeting the right people? A consistently low rate might mean you're talking to the wrong audience.
- How can we improve our ROI? Even small tweaks that bump up your conversion rate can lead to huge revenue gains without spending a penny more on ads.
For B2B companies, a funnel that’s dialled in is especially critical. We cover specific strategies for this in our guide on lead generation for B2B businesses. Improving your lead conversion rate isn't about chasing vanity metrics; it’s about building a smarter, more predictable, and more profitable marketing machine.
How to Accurately Calculate Your Lead Conversion Rate
Before you can improve anything, you have to measure it. Thankfully, the basic formula for lead conversion is refreshingly simple. It’s a straight-up percentage that tells you how good you are at turning potential interest into actual revenue.
At its most basic level, the formula looks like this:
Lead Conversion Rate = (Total Number of New Customers / Total Number of Leads) x 100
As a practical example, say your marketing pulled in 500 leads last quarter. Out of those, 25 eventually signed on the dotted line and became paying customers. Your calculation would be (25 / 500) x 100, giving you a lead conversion rate of 5%.
This single number is your starting point—your baseline. It means for every 100 leads that walk through your digital door, five become customers. Knowing that number is incredibly powerful for forecasting revenue and setting growth targets that are actually achievable.
MQL vs SQL: Why the Distinction Is Everything
But here’s where things get a bit more nuanced. The accuracy of that 5% hangs entirely on one critical detail: how you define a “lead.” A fuzzy definition will mess up your numbers and hide the real problems in your funnel.
This is why smart B2B companies don't just lump everyone together. They split their leads into (at least) two key categories:
Marketing Qualified Lead (MQL): This is someone who has dipped their toe in the water. They’ve downloaded a whitepaper, signed up for a webinar, or engaged with your marketing in some way. They’re curious, but not ready for a sales call just yet.
Sales Qualified Lead (SQL): This is an MQL that’s been properly vetted and is ready for a direct conversation with your sales team. They fit your ideal customer profile—right company size, budget, authority—and have shown high-intent behaviour, like requesting a demo.
Making this distinction is a game-changer. A low MQL-to-SQL rate tells you your lead nurturing is weak. A low SQL-to-customer rate points to a breakdown in your sales process. Without this clarity, your sales team ends up wasting hours chasing ghosts.
Getting Granular: Different Formulas for Different Stages
A single, high-level conversion rate is useful, but it doesn't tell the whole story. To truly understand where your funnel is leaking, you need to calculate conversion rates at each major stage. This approach gives you a much clearer, more actionable picture of your performance.
Here’s a breakdown of the key formulas you should be tracking.
Lead Conversion Rate Formulas by Funnel Stage
| Funnel Stage | Formula | What It Measures |
|---|---|---|
| Visitor-to-Lead | (Total Leads / Total Website Visitors) x 100 | The effectiveness of your website and lead magnets at capturing initial interest. |
| Lead-to-MQL | (Total MQLs / Total Leads) x 100 | How well your initial content engages and qualifies new leads. A low rate here means your top-of-funnel content isn't resonating. |
| MQL-to-SQL | (Total SQLs / Total MQLs) x 100 | The efficiency of your lead nurturing process. Are you successfully guiding interested prospects toward a sales conversation? |
| SQL-to-Opportunity | (Total Opportunities / Total SQLs) x 100 | How effectively your sales team converts qualified leads into active sales pipeline deals. |
| Opportunity-to-Win | (Total New Customers / Total Opportunities) x 100 | Your sales team's closing ability. This is the classic "close rate." |
| Overall Lead-to-Customer | (Total New Customers / Total Leads) x 100 | The big-picture view of your entire funnel's health, from first touch to final sale. |
By tracking these individual rates, you can stop guessing where the problems are. If your MQL-to-SQL rate is tanking, you know you need to fix your mid-funnel nurturing, not just throw more money at top-of-funnel ads.
The Right Tools for Automated Tracking
Trying to track all this in a spreadsheet is a recipe for disaster. It’s not just a ton of work; it’s practically guaranteed to be full of errors. To get data you can actually trust, you need to automate.
1. Customer Relationship Management (CRM) Systems: Tools like HubSpot and Salesforce are the command centres for your funnel. They’re built for this stuff. You can define your lead stages (MQL, SQL, Opportunity) and let the system automatically track movement between them. More importantly, they connect each lead back to its original source, so you know which channels are really working.
2. Web Analytics Platforms: You can't ignore the top of the funnel, and that's where Google Analytics shines. By setting up conversion goals—like a form submission or a lead magnet download—you can see exactly how many website visitors are taking that first crucial step. This helps you understand which pages and campaigns are best at grabbing initial attention.
When you integrate these tools, you create a seamless flow of data from the first click to the final contract. Measurement stops being a chore and becomes your strategic advantage.
Before you invest heavily in new lead generation assets, it’s worth diagnosing your current setup. A great way to start is with a free tool like the Magnethive lead magnet audit, which provides a comprehensive report, including an analysis of your current lead magnet, three AI-powered ideas for new ones, and an overview of the potential ROI impact.
So, What's a Good B2B Lead Conversion Rate Anyway?
After you've done the maths and have your lead conversion rate, the first question is always the same: "Is this number any good?"
The honest answer? It depends. There’s no magic number that works for everyone. Context is king. A stellar conversion rate in one industry could be a massive red flag in another.
Let's explore a practical example. Imagine a SaaS company selling a $49/month tool. Now, picture a firm selling six-figure manufacturing equipment. Expecting them to have the same conversion rate is just unrealistic. The SaaS business might hit a 5% conversion rate from their website and be happy. The equipment guys? They’d be popping champagne for a 0.5% rate, because a single deal is worth a fortune.
This is why looking at industry benchmarks is your first real move. It stops you from chasing generic averages and helps you understand what's actually achievable in your corner of the market.
How Your Industry Changes the Game
Different industries play by different rules. Sales cycles, customer expectations, how complex the purchase is—all these things massively impact what a "good" conversion rate looks like. For most B2B companies, the average visit-to-lead conversion rate floats somewhere between 1% and 3%.
But some sectors just blow that average out of the water.
Take professional services, for example. These businesses are often conversion machines. Legal services, as a sector, report a median conversion rate of 7.4% from search, which is one of the highest rates out there. You can dig into more detailed conversion statistics to see where you stack up.
A benchmark isn't a finish line; it's a starting line. It's the data point you use to start optimising your funnel and leaving the average in your dust.
What this tells us is that high-trust fields can get incredible results when they nail their value proposition and build real credibility. Knowing this helps you set targets that are ambitious but still grounded in reality.
Not All Channels Are Created Equal
Just like industry, the channel that delivered the lead is a huge piece of the puzzle. A lead from a super-specific Google search has a completely different mindset than someone who just scrolled past your ad on social media. If you're not segmenting conversion rates by channel, you're basically flying blind with your budget.
Think about it like this: different channels catch people at different points in their journey.
Organic Search: This channel is often the conversion king. Someone typing "best CRM for small law firms" into Google isn't just browsing; they're actively hunting for a solution. Their intent is sky-high, making them prime candidates to convert.
Paid Search (PPC): Right up there with organic, paid search grabs high-intent users. A killer ad and a focused landing page can deliver solid conversion rates, often averaging around 3.2%. You’re showing up with the answer at the exact moment they have the question.
Social Media: This is more of a top-of-funnel play. People are scrolling, discovering, and getting to know you. As a result, direct lead conversion rates are usually lower, hovering around 1.5%. They're not in "buy mode," so you need to nurture them a bit more.
Email Marketing: Done right, email is a beast. You're talking to a warm audience—people who literally asked to hear from you. That pre-built relationship means higher conversion rates, typically averaging around 2.6%.
When you slice your data this way, you start seeing what really works. You can double down on your high-performing channels and rethink the ones that are lagging. This is how you turn a spreadsheet of numbers into a real, strategic advantage.
100% Free Lead Magnet Audit
Our AI analyzes your website and delivers custom growth strategies in seconds.
Common Pitfalls in Measuring Lead Conversion
Measuring your lead conversion rate sounds simple, right? Leads in, customers out. But if your data is even slightly off, you could be quietly killing your entire strategy, pouring money down the drain based on bad information.
Getting this right means understanding where the numbers can lie to you. The journey from a prospect's first click to a signed contract is almost never a straight line, especially in B2B.
One of the biggest traps is leaning on last-touch attribution. This model gives 100% of the credit for a sale to the very last thing a lead did before converting. Imagine a prospect reads three of your blog posts, attends your webinar, and then finally clicks a link in an email to book a demo. Last-touch gives all the glory to the email.
This thinking completely ignores the heavy lifting the blog posts and webinar did to build trust and educate the prospect. It creates a warped view of your marketing, making bottom-of-the-funnel channels (like branded search) look like heroes while undervaluing the top-of-funnel workhorses (like social media or organic content) that started the whole conversation.
The Messy Reality of the B2B Customer Journey
Let's be real: B2B sales cycles are long, winding roads involving multiple people. A prospect might see your LinkedIn ad, find a case study through Google, and then have a colleague forward them an email. This can happen over weeks, even months.
Trying to track this tangled web is a nightmare. Without a multi-touch attribution model that gives partial credit to each touchpoint, you’re flying blind. You might cut the budget for a channel that seems to be a dud, not realising it’s the spark that lights most of your fires.
A flawed measurement system is worse than no measurement at all. It gives you the confidence to make the wrong decisions, like gutting the budget for the very channels filling the top of your funnel.
Bad Data and Teams Speaking Different Languages
Another gremlin in the machine is poor data hygiene. Dirty data will completely throw off your metrics, making them totally unreliable.
Here are the usual suspects:
- Duplicate Leads: The same person fills out three different forms on your site and now exists as three separate "leads" in your CRM. This inflates your lead count and makes your conversion rate look worse than it is.
- Inconsistent Definitions: Marketing celebrates every eBook download as a "Marketing Qualified Lead" (MQL), but Sales only considers a demo request a true "Sales Qualified Lead" (SQL). This gap means your funnel metrics will never add up, leading to endless finger-pointing and a broken handoff process.
The fix? Get marketing and sales in a room to hammer out a Service Level Agreement (SLA). This document puts into writing what defines a qualified lead at each stage (Lead, MQL, SQL) and sets clear rules for how quickly sales needs to follow up. It ensures everyone is working from the same playbook.
Tracking What Happens in the "Dark"
Finally, not every conversion happens where you can see it. A prospect might see your booth at a trade show, hear about you on a podcast, or get a referral in a private Slack channel. These offline and "dark social" interactions are notoriously hard to track and often just get lumped under "Direct" traffic in your analytics.
You'll never track everything perfectly, but you can get closer. For offline events, use unique URLs or QR codes. On your web forms, add a simple, optional field asking, "How did you hear about us?" This self-reported data can uncover the hidden channels that are actually driving growth, giving you a much truer picture of what’s really moving the needle.
A Blueprint for Improving Your Conversion Rate
Trying to improve your leads conversion rate isn't about finding one magic bullet. It's about systematically swapping out points of friction with moments of genuine value. The old playbook of gating a generic eBook behind a form is just not cutting it anymore. Today’s buyers expect you to solve their problems instantly and personally, not just hand them more homework.
This is where a value-first marketing approach, built around interactive tools, gives you a serious edge. Instead of asking for an email in exchange for a static PDF, you’re offering a tangible outcome. Right now.
The Power of Interactive Lead Generation
Think about the last whitepaper you downloaded. Did you drop everything and read it? Or did it end up in that digital graveyard you call your "to-read" folder? Now, compare that to a free tool that gave you instant, personalised insights.
Interactive lead magnets like quizzes, calculators, and assessments don't just snag an email address; they solve a small but real problem for the user on the spot.
This simple shift changes the entire game from a transaction to a consultation.
- Quizzes: Help people self-diagnose a problem. A practical example is a software company offering a "Which Project Management Style Fits You?" quiz that guides users to the right product tier.
- Assessments: Give a user a grade on their maturity in a specific area. A "Cybersecurity Risk Assessment" naturally highlights the gaps your service can fill.
- Calculators: Show a clear ROI or potential savings. A solar panel company might offer a "Solar Savings Calculator" that turns an abstract benefit into a hard number.
These tools deliver immediate value, which builds trust and qualifies a person’s intent way more effectively than a passive download. Let's be honest, someone who completes an ROI calculator is a much hotter lead than someone who just grabs a guide.
Designing a High-Converting Interactive Experience
Building an interactive tool that actually drives a high leads conversion rate follows a pretty clear blueprint. It all starts with having real empathy for your customer's biggest headaches.
1. Identify a Core Customer Pain Point: What's a nagging question your ideal customer is constantly wrestling with? It could be anything from "Am I overpaying for my current service?" to "Is my marketing strategy actually ready for next year?" The best tools nail these specific, high-stakes questions.
2. Design a Frictionless User Flow: Keep it simple. Keep it focused. Only ask the questions you absolutely need to deliver a valuable result. Each question should feel like the next logical step, pulling the user smoothly toward their personalised report or score.
3. Deliver Instant, Personalised Value: This is the moment of truth. The result can't be a generic "Thanks, we'll be in touch." It needs to be a custom report, a score with actionable recommendations, or a crystal-clear financial calculation. The more specific and valuable the result, the more trust you earn.
4. Route Leads Intelligently: Not every lead is the same. Use the data you've gathered from the tool to automatically segment and score them. A lead who flags a high budget and an urgent need? Route them straight to sales. A lower-intent lead? Add them to a nurturing sequence. This simple alignment makes sure your sales reps are only talking to the best-fit opportunities. Digging into user behaviour is key here; for example, good strategies for increasing website conversions through analytics often start with understanding why people leave your site.
The diagram below breaks down the major pitfalls in measurement, zeroing in on data, attribution, and getting your teams on the same page.
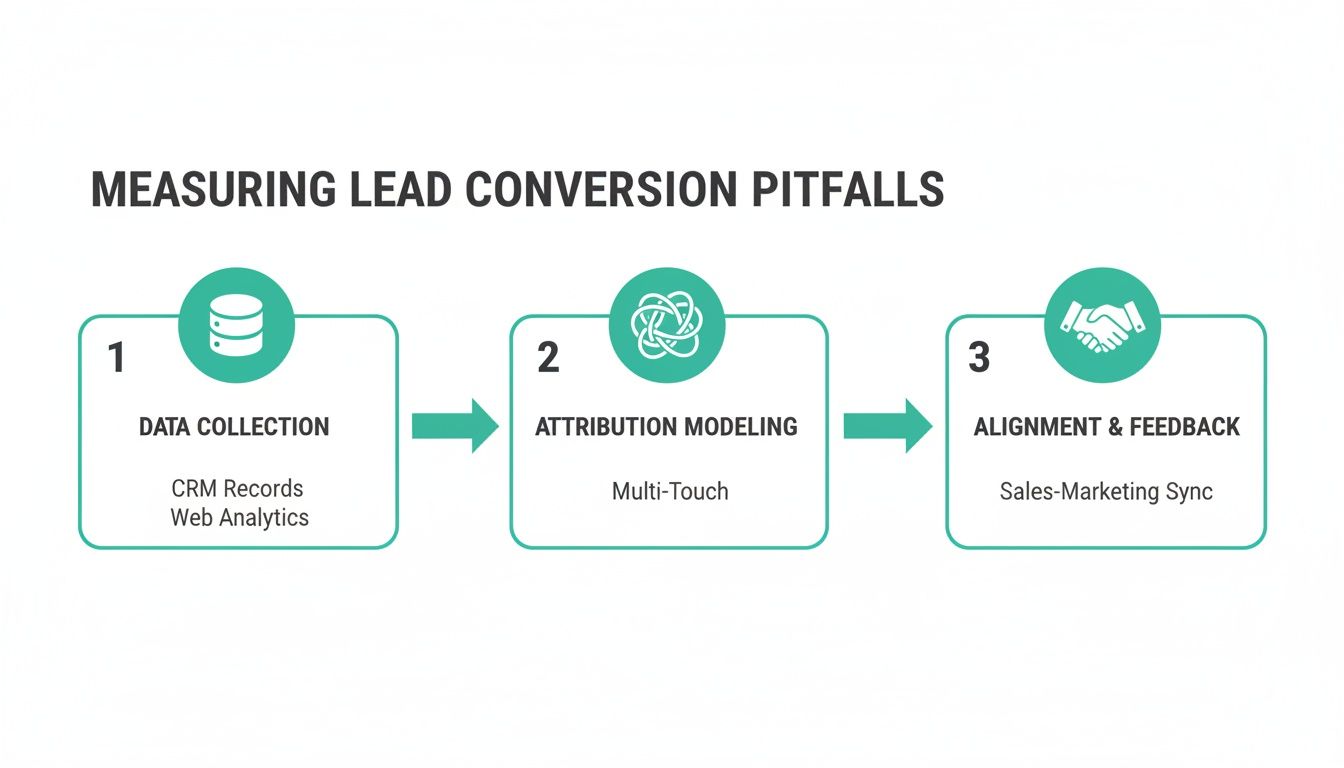
This really drives home that you can't measure accurately without clean data, a sensible attribution model, and marketing and sales teams that are actually in sync.
By shifting your focus from just capturing leads to delivering immediate value, you change the entire dynamic. You become a helpful advisor instead of just another marketer asking for an email—a change that directly boosts your leads conversion rate.
This strategic shift, moving away from static content and toward dynamic, genuinely helpful tools, is the core of modern lead generation. By giving value upfront, you don't just improve your conversion numbers; you attract higher-quality leads who are actually ready for a sales conversation. For a deeper dive, check out our guide on conversion rate optimisation in marketing.
Analysing Conversion Rate Variance Across Markets
Your lead conversion rate isn't a single, static number. A figure that looks like a home run in one country can be a total strikeout in another. Why? Because you’re dealing with completely different regional economies, cultural buying habits, and levels of market maturity.
One of the most common mistakes is expanding into a new territory and expecting the same results. What works wonders in North America might fall completely flat in Asia or Europe simply because the underlying psychology of the buyer is different. Getting a handle on these nuances is non-negotiable for any business with global ambitions.
A single global benchmark for your leads conversion rate is not just ineffective; it's a misleading metric that can lead to poor strategic decisions. Success in global marketing requires setting localised, culturally aware key performance indicators.
This means you have to break down performance on a market-by-market basis to get a true picture of what’s actually working.
Cultural and Economic Drivers of Conversion
So, why are these differences so stark? Economic stability plays a massive role. Buyers in more affluent regions often have more disposable income and greater trust in online transactions, which translates to faster decisions. In contrast, emerging markets might be more cautious, requiring a much longer nurturing cycle to build the trust needed for a conversion.
Cultural norms also shape how people behave online. Some cultures want to see every last detail and data point before they even think about committing. Others respond far better to relationship-building and social proof. A one-size-fits-all landing page or lead magnet is guaranteed to miss the mark with at least one of these groups. The whole game is about adapting your pitch to match local expectations.
You can see these divides clearly in e-commerce data. For instance, some Northern European markets convert at over 2.2%, while certain Southern European countries barely break 0.99%. You can discover more insights about e-commerce conversion rates and see just how much this varies. It’s a powerful reminder that a lead from one region can have a fundamentally different level of intent than a lead from another.
Adapting Your Strategy for Global Markets
To actually succeed, you need to go way beyond simple language translation and embrace true localisation. This isn't just about swapping out words; it's about adapting your offers, messaging, and even the types of interactive tools you use to fit each market.
Here’s how to start thinking about it:
- Localise Your Offers: An offer that’s a no-brainer in one market might be totally unappealing in another. Dig into local pricing sensitivities, what the competition is offering, and what "value" really means to that specific audience.
- Segment Your Analytics: Stop lumping all your data into one giant bucket. Create separate dashboards or views in your analytics tools for each key region. This is the only way you'll spot trends and problems specific to each market.
- Deploy Culturally-Aware Tools: An ROI calculator might be the perfect tool for a data-obsessed market. But in a different region, a diagnostic quiz that helps users understand their personal needs could perform ten times better. The goal is always to provide value in a format that feels natural and resonant locally.
By segmenting your approach, you can set much more accurate, geographically-aware KPIs for your teams. This gives you a more nuanced understanding of performance and helps you put your resources where they’ll actually make a difference. For a deeper dive into this, our guide on B2B market segmentation lays out a complete framework.
Got Questions? We've Got Answers.
When you start digging into lead conversion rates, a few questions pop up again and again. Let's clear the air on the most common ones so you can get your measurement straight.
What's a Good B2B Lead Conversion Rate, Anyway?
This is the million-dollar question, and the honest-to-goodness answer is... it depends. There's no magic number that works for everyone. A "good" rate is completely tied to your industry, the channel you're using, and just how valuable your offer is.
If you're looking for a general benchmark, most people say a B2B website visitor-to-lead conversion rate falls somewhere between 1% and 5%. But treat that as a starting line, not the finish line. We’ve seen highly targeted landing pages with killer interactive tools pull in conversion rates well over 10%.
The smartest move? Figure out your own baseline first. Track your numbers for a month. That’s your benchmark. Then, you can start looking at industry averages to see how you stack up.
Isn't This Just the Same as a Sales Conversion Rate?
Nope. People mix these up all the time, but they measure two totally different parts of your customer journey. Getting this right is critical if you want to find the leaks in your funnel.
Lead Conversion Rate: This is all about your marketing's effectiveness at the top of the funnel. It's the percentage of people who see your stuff and take that first step to become a "lead" — like giving you their email for a report.
Sales Conversion Rate: This measures how good your sales team is at their job, further down the funnel. It's the percentage of those leads who actually open their wallets and become paying customers.
Think of it this way: 1,000 people land on your webinar page. 50 of them sign up. Boom, your lead conversion rate is 5%. Then, your sales team works their magic and turns 5 of those 50 attendees into customers. Your sales conversion rate is 10% (from lead to customer).
What Else Should I Be Tracking Besides This One Metric?
Tracking lead conversion rate by itself is a classic rookie mistake. A high conversion rate looks great on a report, but it's completely useless if all those new leads are tyre-kickers or cost you a fortune to get. You need to look at the whole picture to see if your marketing is actually making money.
Focusing on lead volume while ignoring lead quality is like trying to fill a bucket with a hole in it. You're just creating more work for your sales team and burning through cash.
To keep things balanced, keep an eye on these metrics too:
- Cost Per Lead (CPL): How much are you actually spending to get each lead? This tells you if your campaigns are efficient or just expensive.
- Lead-to-Customer Rate: This is your sales conversion rate. It's the ultimate test of lead quality. Are the leads your marketing team is celebrating actually turning into revenue?
- Customer Lifetime Value (CLV): This is the long game. It ensures that the customers you're fighting so hard to win are actually profitable for the business over time.